Learn Trading TUTORIAL
0. Risk & Position Management
The most important part of trading success is Risk Management. Welle's Wilder Jr. (father of RSI, ADX & SAR Indicators) referred to it as "most important, the easiest to learn and hardest to do". The reason for it is that at some point in the past you have made an unreasonably dangerous trade or investment and it worked out giving you the confidence that you can do it just one more time. However, people greatly underestimate the challenge of recovering from a substantial loss. If you end up losing 50% of your account on an over-leveraged trade running into a black swan event, you would need to now make 100% just to get back to even and the pressure on you to make this 100% will be greater than ever before.
The longer a trader has survived in this profession, the more they appreciate the importance of Risk Management. There are not many resources on this but start with the book The Art of Execution: How the world's best investors get it wrong and still make millions. There are also good articles by Conrad Braun (aka Ugly Old Goat):
- How to Achieve the Same Results of a Professional Bitcoin Trader Without Risk - Apr 6, 2018
- Blowing Out at the Bottom with a Smile - Jan 18, 2019
- The Risk/Reward Ratio is a Canard - Mar 30, 2019
- Why Most Bitcoin Traders Lose - Jun 9, 2019
- Money Management Trumps All - Jul 31, 2019
Some of these articles were discussed with Leah Wald on a podcast titled "Importance of Risk Management & Hodling"
Finally, I would strongly recommend Risk & Position Management Webinar once you have completed learning at least some of the Technical Analysis Tools referenced in this tutorial. Please make sure you have a plan before putting any significant capital into a trading portfolio.
Below is a reference on Technical Trading. If you are looking for a single comprehensive resource, the only one I can recommend is School.Stockcharts.com. It helped me a lot in the early 2000's when I was starting out and it's just as useful today.
1. Everything Starts with Candlesticks
If you do NOT understand how to read candlesticks, you should NOT be trading. Spend as much time as needed to familiarize yourself with their basics then review all the different types of candles that exist. You can also read more about their role in identifying Support & Resistance (topic 2). Additional PDF references are here, here & here.
There is no dedicated Volume section in this tutorial other then Volume related Indicators and Oscillators (Topic 4). While I personally do not pay as much attention on volume as price, it should be something to always have in the back of your mind and keeping an eye on as you learn about ideal entries and exits.
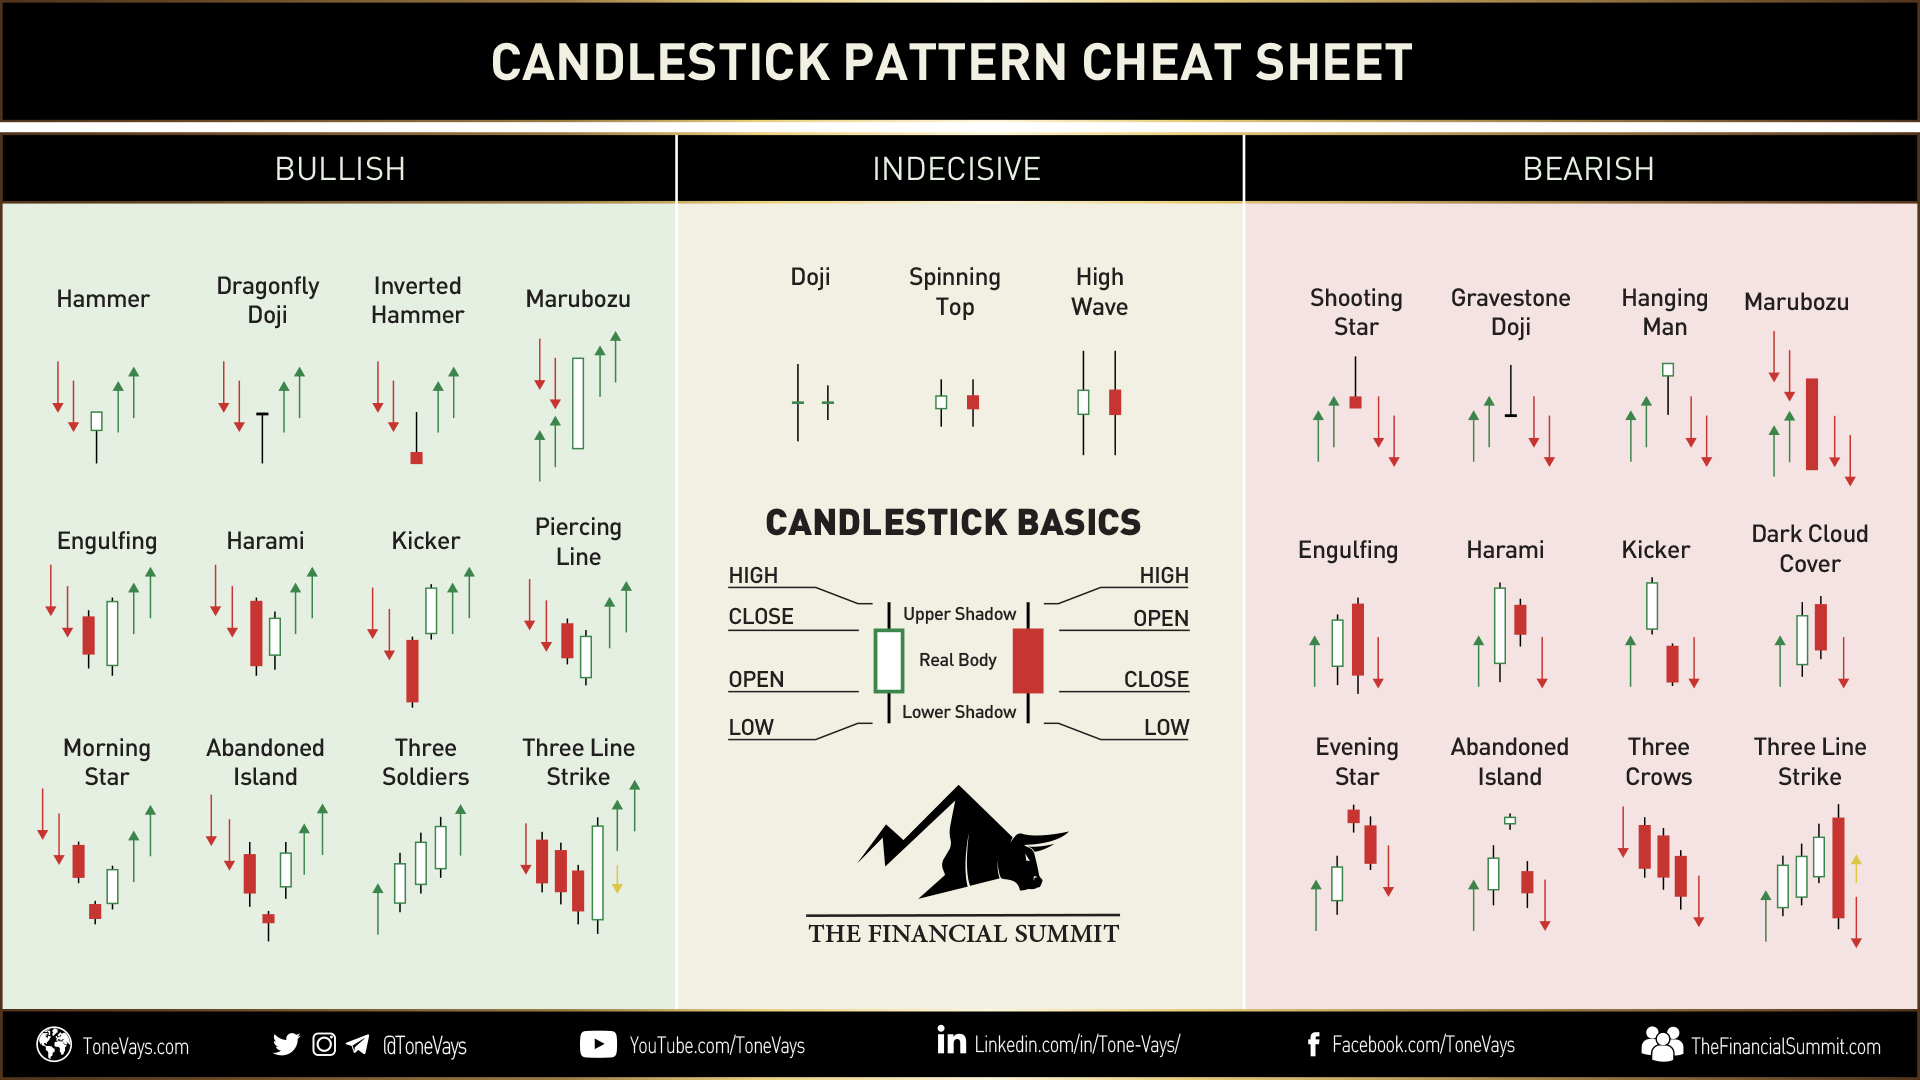
The candlesticks that matter to me most are Doji, Shooting Star & Hammer. If you learn anything from my video’s & seminars, I hope it’s how to utilize these 3 candles.
2. Support & Resistance
This comes in many forms, but I like to simplify it to just 4 types:
- A. Prior Highs & Lows – Where prior points of interest create ideal breakout or reversal targets (Also see Pivot Points)
- B. Trend Lines & Channels – Where a straight line can be drawn connecting 3 highs or lows at different price points
- C. Moving Averages – There are always debates on Simple vs. Exponential (I prefer the Simple 50 & 200 as a reference)
- D. Fibonacci Retracements & Fans - These Golden Ratio levels act like magnates that can attract & repel price moves
Understanding the important role of Support & Resistance highly important for successful trading, here is a good summary of the above concepts.
In my experience, Double Tops/Bottoms are NOT Resistance/Support (Triple is even less so). I believe you only get one chance to sell the top and one chance to buy the low. If you see a Double Top or Bottom expect a Breakout or Breakdown soon.
3. Chart Patterns
While chart patterns can be used to help identify Reversal or Continuation of trends, I prefer to focus more on the continuation side of the analysis. They are not only helpful in identifying the potential direction of a move, they also help with identifying target points of how big the move should be. Make sure read the Intro to Chart Patterns section first before moving on to specific examples.
Some of my favorite patterns are: Ascending & Descending Triangles (Symmetric Triangles as well, but they are less predictable as to which direction it will break). I do however like Symmetric triangles when part of a Flag Pennant. (like shown here). Other chart patterns to recognize are Cups & Handles along with Head & Shoulders (or Inverse Head & Shoulders). Additional resources can be viewed here, here & here.
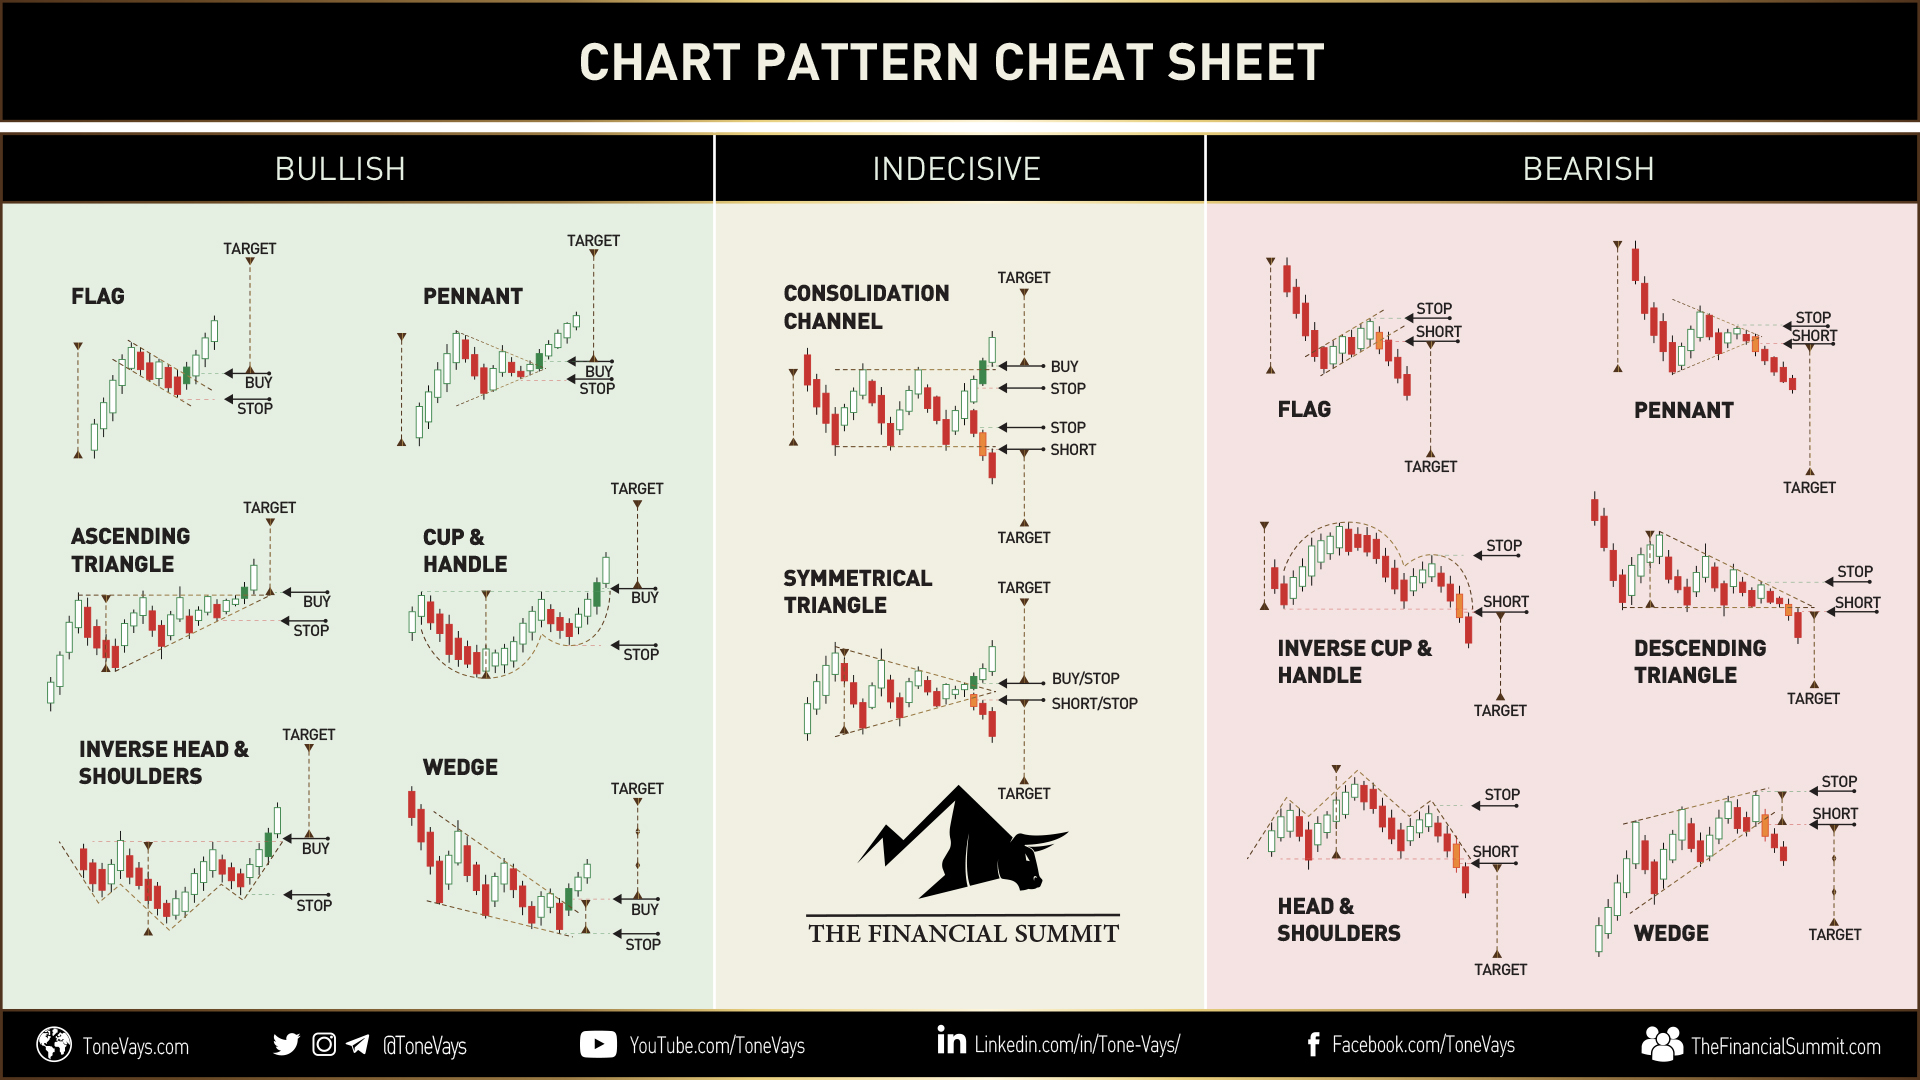
Head & Shoulders are usually obvious and also identified with just trend lines. What I DO NOT really care for are Wedges & Harmonic Patterns (ex: Crab, Butterfly, Bat)
4. Indicators
Before we dive into individual trading indicators, we should discuss the different categories of indicators (must read). At the highest level they can be broken down into Overlays vs Oscillators. Overlays are indicators that are plotted directly on top of a price chart and hence use the same scale as price (though they could be Volume based). Oscillators on the other hand, are plotted above or below a price chart and have their own independent scales. Both Overlays and Oscillators come in Lagging, Leading or Coincident varieties which have their own advantages and disadvantages. (and here). Oscillators come in all kinds of types including being Centered where they fluctuate around a specific value (usually 0), Bounded where they have a maximum/minimum value that can be achieved, while others (like OBV) have neither of those properties (hence it should not really be called an Oscillator).
4-A. OVERLAYS
The following is a list of my favorite Technical Overlays with links to references on how they are often used:
- Parabolic SAR - Designed as a trading system to always be invested in the market long or short, but only performs well in trending markets. Ideally should be combined with a trend identifying compliment like Moving Averages or ADX Oscillator. Read more about it here, here & here.
- Bolliner Bands - A lagging indicator used to identify overbought/oversold conditions likely to revert to the mean as well as upcoming breakouts/breakdowns with no inclination on a direction. Read more about it here, here, here & here. There is also a similar overlay called Keltner Channel.
- Ichimoku Cloud - A versatile system that identifies current (and forecasts future) support & resistance levels, identifies trend direction, momentum and strength and most importantly, provides clear trading entries. As for stop-loses, you might need to come up with a plan that works for you. Additional resources can be found here & here.
- Volume Profile - Is a way to look at volume in a unique way as it shows you how much liquidity has changed hands at a specific price. Depending on your educational source, it can be refereed to as Volume-by-Price (StockCharts) or Price-by-Volume (Investopedia). And as the leading explained it can be displayed as Visible Range, Fixed Range or Session Volume. TradingView actually has a good write up about it as well.
- Supertrend - Designed as trading system to always be invested in the market, Superterend uses Average True Range (ATR) to identify a trailing stop-loss which when breached can activate the opposite position in the market. It is similar to Bloomberg's Trender which uses Standard Deviations instead of ATR for an identical looking overlay. Read more about Supertrend here & here.
Always have a stop loss for the trades you enter, either mentally or automated you have to know ahead of time at what point your trade failed.
4-B. Divergence
Before we move to the introduction of Oscillators we should discuss one important concept known as Divergence. Many of the Oscillators in the next section provide their own internal signals but in addition to that, most are also used as Leading Indicators when Divergence is identified. This can take place even when the indicator is of the Lagging variety. You may want to come back to these additional resources here, here and here, after becoming more familiar with the Oscillators in the next section so it is much clearer on what is being referenced. In addition to Divergence, there is a concept of Hidden Divergence. Personally I am not a huge fan of trusting Hidden Divergence but feel free to read more about it here.
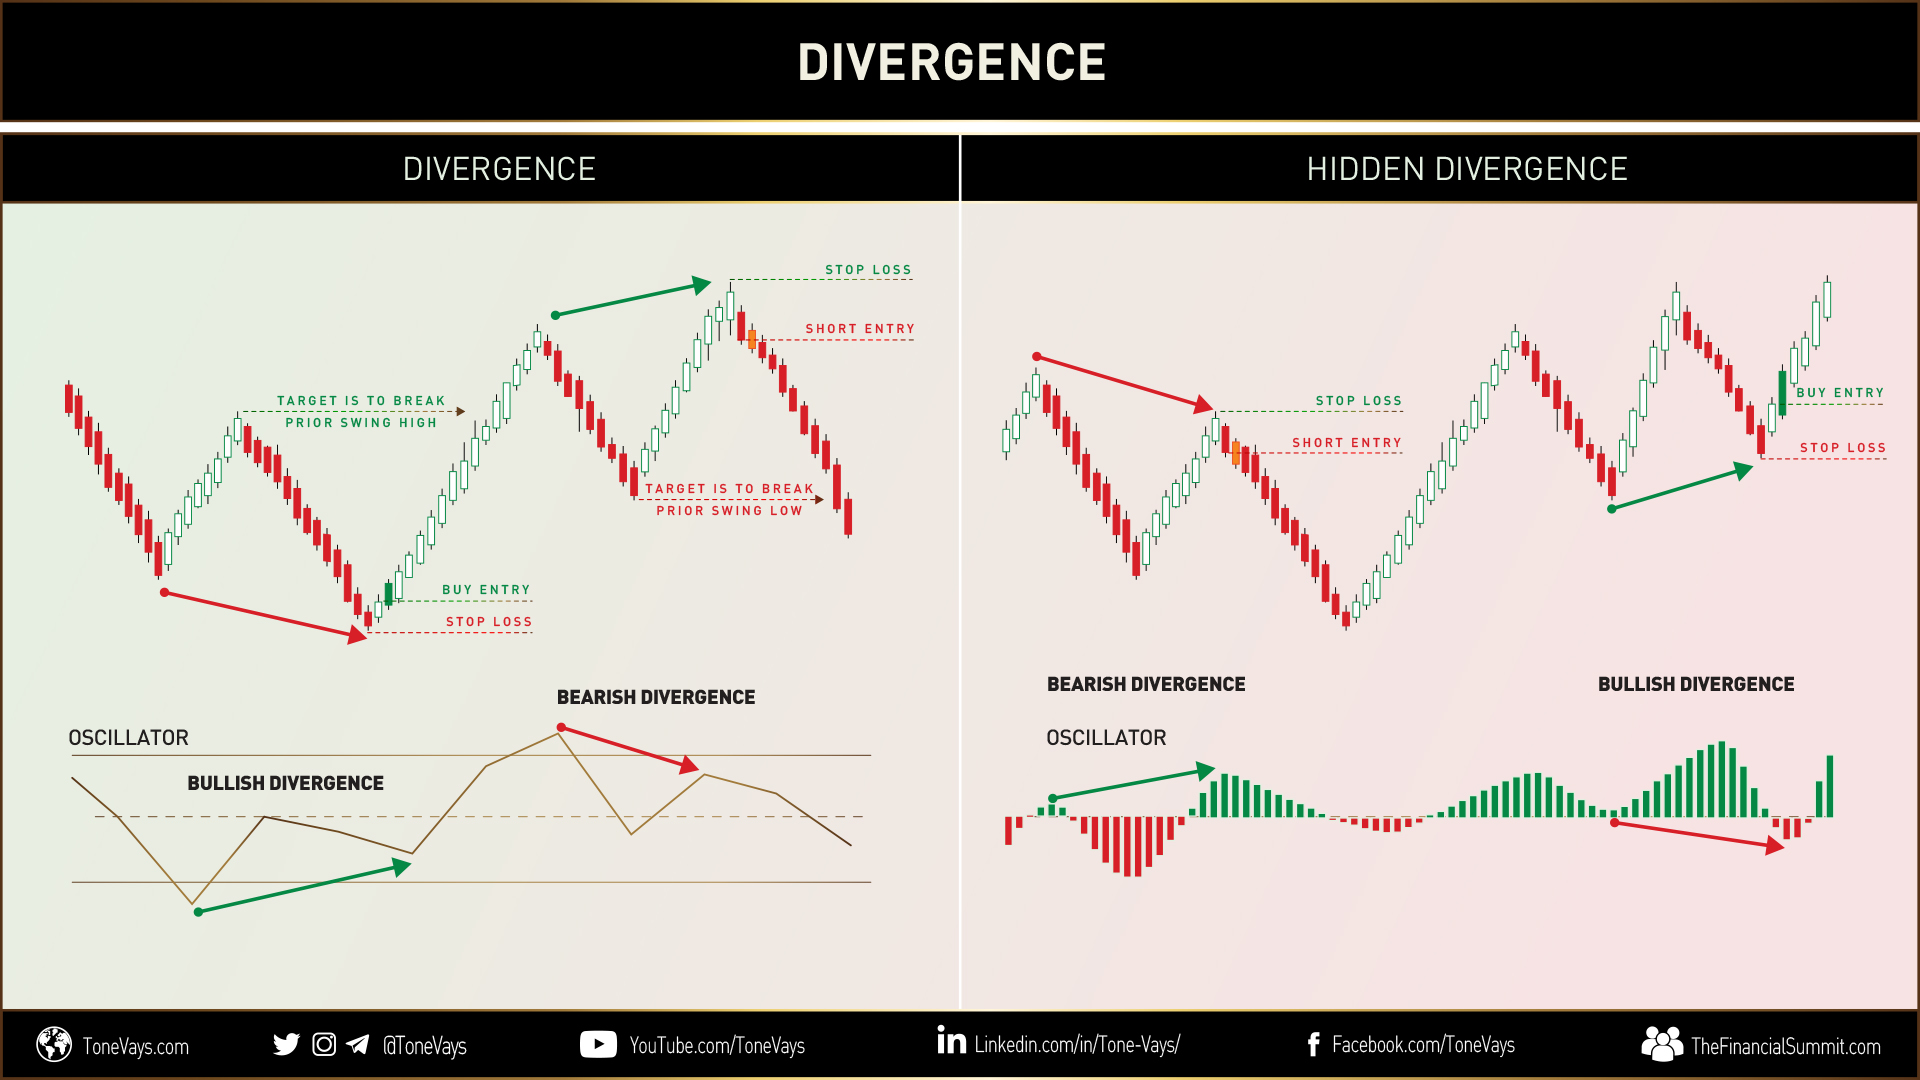
Never assume that Divergence will reverse the price. Always wait for the price to turn first and only after a candle or two have closed creating a price top, can Divergence be identified.
4-C. Oscillators
Once again a good thing to review is the Introduction to Technical Indicators and Oscillators. Since the amount of Technical Indicators is, we will only focus on a select few. Just like Moving Averages, you decide if you should focus on the more popular Oscillators with default settings to on the group think side of other traders, or should focus on the more obscure ones along with identifying non-conventional indicator input parameters.
- MACD - A Lagging Unbounded-Centered Oscillator that takes advantage of both trend & momentum. MACD being a Lagging Indicator is not useful for identifying overbought/oversold conditions, but can still be used as a Leading Indicator when trading divergence. (See additional reading here, here, here & here).
- RSI - A Leading Range-Bound Indicator meant to identify assets in overbought or oversold conditions as well as areas of divergence. Read more about it here, here, here & here.
- MFI - A Leading Range-Bound Indicator meant to identify assets in overbought or oversold conditions as well as areas of divergence. It is also referred to as a Volume-Weighted RSI as the formula adds the component of volume to price momentum. Read more about it here & here.
- CMF - A Leading, Centered & Range-Bound Indicator that is mostly volume based to identify buying and selling pressure. Its greatest use is spotting divergence in trends. Read more about it here & here, but make sure you understand how it differs from MFI. Also make sure you don't confuse it with Chain Oscillator. (also here & here).
- Stochastic - A Leading Range-Bound Indicator that measures the momentum (or Speed) of an asset using only its price for calculation as it compares to recent range. It is mostly used in 3 ways: Spot good entries when stochastic lines crosses it's moving average, identify areas of overbought/oversold & divergence. Read more about it here, here & here. But also make sure you fully understand the difference between Fast & Slow Stochastic.
- Williams %R - A Leading Range-Bound Indicator that is the inverse of the Stochastic Oscillator. It becomes a preference as to which a trader prefers. You can read more about it here, here, here & here.
- StochRSI - A Super-Leading Range-Bound Indicator that measures momentum of momentum of price. While it can be used to identify Overbought/Oversold Conditions, the indicator is best used to instantly spot potential changes in trend. Before reading additional reference on StochRSI, might be best review the the differences between its two components, RSI & Stochastic. After that additional resources can be found here, here & here.
- CCI - A Lagging (or at best Coincident) Unbounded Centered Indicator that tries to identify trend or cyclical turns in an asset. It measures the current price relative to a moving average which can also be used to identify Overbought/Oversold extremes as well as Divergence. Additional reference are here, here, here & here.
- Aroon - A Coincident Range-Bound Indicator that is unique in it's momentum category because it measures time relative to price. It is ideal for identifying new trends as they take place especially multi consolidation periods. Created in the mid 90's it's fairly new and many trades do not use it yet. Read more about here, here & here. There is also the Aroon Oscillator which is just the combination of the two Aroon Up/Down lines.
- ADX - A Lagging Range-Bound Oscillator that is ideal to identify trending markets. It is pretty unique to other Oscillators so it complements others very well. This indicator is somewhat complex and is only ideal in cyclically trending assets. If your asset is too volatile and tends to quickly change direction from bull to bear or is not volatile at all (aka stable), the Average Directional Index might not be ideal. Read more about it here, here & here.
- OBV - A Leading Unbounded Indicator that is completely Volume based. It measures the under the hood buying and selling pressure that is used to identify Divergence and confirm trending markets. OBV achieves this by keeping track of the cumulative volume by either adding or subtracting most recent volume from the total. Read more about it here, here, here & here.
- ADL or A/D - A Leading Unbounded Indicator that is Volume based and very similar to OBV. It measures the underlying buying and selling pressure by keeping track of cumulative volume over time by adding it on up days and subtracting on down days. Unlike OBV however, the decision to add or subtract is based on the closing price relative to the trading day instead of comparing the closing price relative to the previous day close. Read more about it here, here, here & here.
- Klinger - A Leading Unbounded Centered Oscillator that is Volume based but unique due to the concept of a Volume Force that identifies an assets current trend. It then applies Exponential Moving Averages on this Volume calculation so it's like MACD but on volume rather than price. There is not much written about it but you can find some additional info here.
Try not to use too many Oscillators, especially ones of similar type. When you have too many on the same screen, you will never be able to get a clean signal as everything will conflict.
5. Tone's Momentum Reversal Indicator (MRI)
Before diving into the usefulness of the Momentum Reversal Indicator (MRI), it is important to understand the nature of Cycles and Time. Understanding the importance of time was made clear to me from reading Martin Armstrong work including his Model Methodology. Back when I had my Bloomberg terminal, I was an avid trader of TD Indicators which looks to be an evolution of the SEQUENTIAL "The Third Element of Thrust Dynamics" from Larry Williams that was taught to the late Tyler Jenks of Lucid Investments. After working with Tyler Jenks and making several changes to these systems, the MRI was born.
The Momentum Reversal Indicator looks to identify trend starts based on price and time and spots very critical point where this trend might end based on time as long the trend remains in tacked. A trend is defined based on closing prices greater (or lower if downtrend) than 4 periods earlier and comes to an end after Nine of these period. After that, multiple trend extensions can start for full exhaustion. It is used across all time frames and is ideal when exhaustion lines up on several time frames like Weekly & Daily.
NOTE: MRI should be available for a one time fee, but subscription access will eventually replace it. It also comes with a full day webinar course on how to apply it to Trading View charts, customize its features and of course best trading practices.
MRI is an advance indicator for experienced traders, and it is not a one size fits all. 5 different traders can be trading it differently because it provides lots of information.
6. Hyperwave
Hyperwave Theory is a trading system developed by D. Tyler Jenks to trade markets that resemble what most people simply call a Bubble. In February 2020, the book titled Hyperwave Theory: The Rogue Waves of Financial Markets was release thanks to combined efforts of Tyler D. Coates & Leah Wald along side Tyler Jenks to better explain this trading method and pass on Tyler's life work. Here is a short video that introduced Hyperwave on their YouTube Channel and here is Tyler Jenks first appearance on my channel: On the Record - GBTC & Hyperwaves Explained. Additional free videos on Hyperwaves can be viewed in this video playlist, but those who are really interested in learning the details, the advanced Hyperwaves tutorials are available purchase in the On Demand Section, along with Tyler's other systems like Consensio & Seljen.
RIP: Tyler Jenks passed away July 23rd, 2019 just a few days before his fund Lucid Investment Strategies was to launch and a few months before the first Financial Summit. It was a sad day and we will never forget his greatness. Several Commemorative videos have been done in his honor: RIP Tyler Jenks - You Will Be Missed w/ Leah Wald & Celebrating Hyperwave Book Release w/ Leah Wald & Friends
"All Hyperwaves are Bubbles, but not all Bubbles are Hyperwaves"
"Don't tell me what to buy, tell me when to buy it"
"Your outlook on the market needs to change with every new piece of data"
Additional Study
Here are references like books and exams that professional need to be familiar with:
- Chartered Markets Technician (CMT) Exam website has lots of resources for those interested in the highest level of Technical Analysis
- Candlesticks, Fibonacci & Chart Patterns (275 pages)